GeoGrade Engine
A Python-based standalone desktop application for automated Soil Classification using the Unified Soil Classification System (USCS).
The Engineering Problem
Soil being a natural material can behave unpredictably as it suffers from intrinsic spatial variability. Classifying soils is one of the most essential steps in geotechnical engineering, guiding foundation design and land development. However, manual classification takes time, requires experience, and is highly prone to errors, which can negatively affect both learning environments and active fieldwork. Current automated methods are often restricted in scope or demand high computational resources.
Methodology & Benefits
GeoGrade was developed as an accessible desktop application equipped with a robust graphical user interface (GUI). It leverages conventional input data from Atterberg limits and sieve analysis to automatically calculate key metrics such as D10, D30, D60, the coefficient of uniformity (Cu), and the coefficient of curvature (Cc).
By combining technical rigor with an intuitive format, the software obviates calculation mistakes, saves critical engineering time, and improves the understanding of soil characteristics in real-time.
Interface & Visualizations
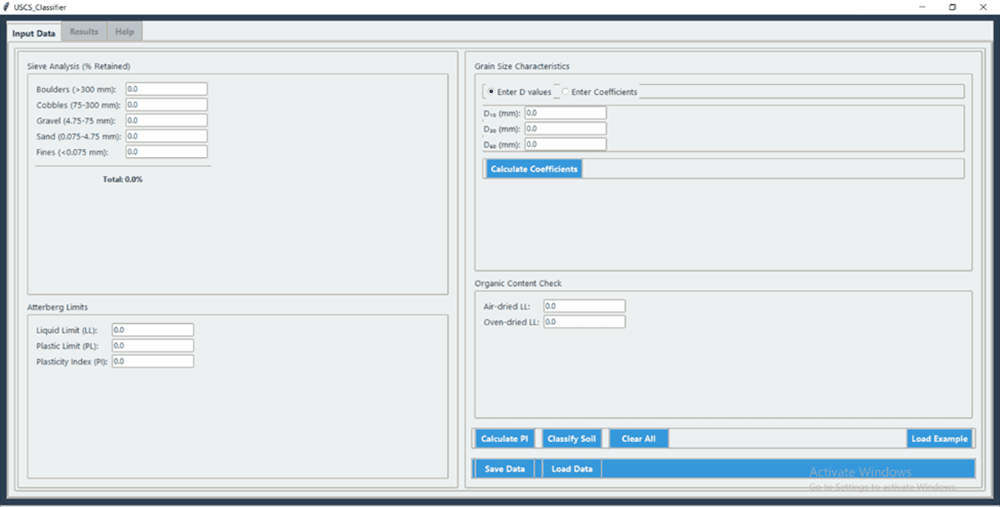
Automated Sieve Analysis
Interactive GUI for inputting total weight and retained sieve data, triggering real-time calculations without manual Excel sheets.
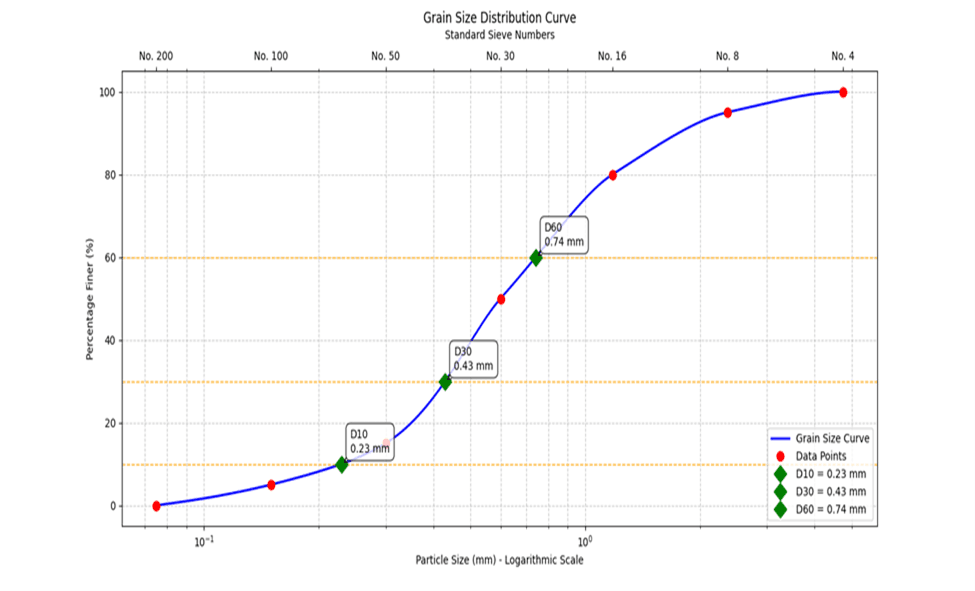
Grain Size Distribution Curve
Smooth distribution plots generated using SciPy PCHIP interpolation to pinpoint D10, D30, and D60 intercepts mathematically.
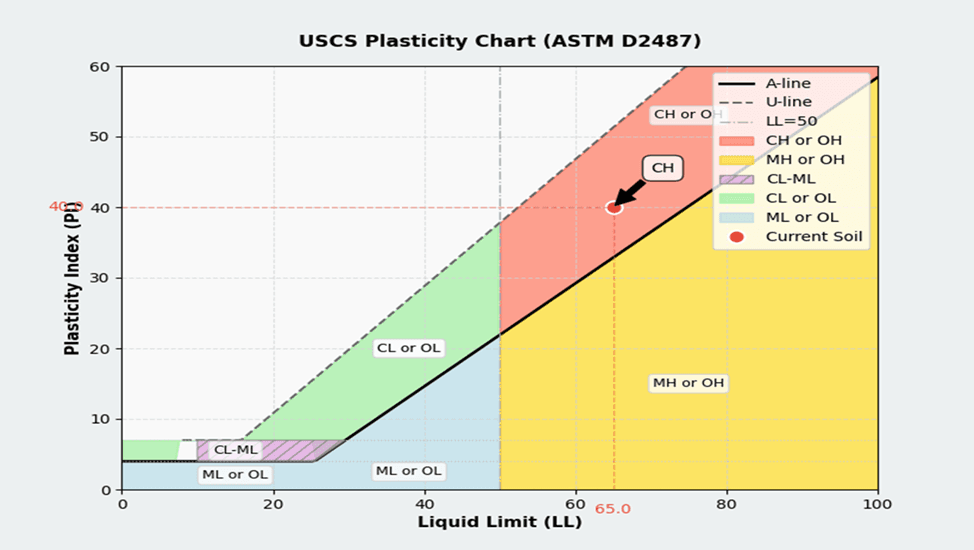
USCS Plasticity Chart (ASTM D2487)
Matplotlib-powered Casagrande plasticity chart plotting Liquid Limit (LL) and Plasticity Index (PI) against the A-line and U-line for visual verification of clay vs silt classification.
Algorithmic Core
Beneath the GUI, the software uses robust root-finding and interpolation logic to extract the exact particle diameters at 10%, 30%, and 60% passing thresholds. These values are then defensively evaluated to calculate the fundamental soil coefficients required for USCS classification.
import numpy as np
from scipy.interpolate import pchip
import matplotlib.pyplot as plt

def analyze_soil_gradation(sieve_sizes, percent_passing):
    """
    Computes D10, D30, and D60 from Sieve Analysis data
    using PCHIP interpolation to avoid oscillation.
    """
    # Reverse arrays to be monotonically increasing for interpolation
    x = percent_passing[::-1]
    y = sieve_sizes[::-1]

    interp_func = pchip(x, y)

    d10 = interp_func(10)
    d30 = interp_func(30)
    d60 = interp_func(60)

    cu = d60 / d10 if d10 > 0 else 0
    cc = (d30 ** 2) / (d10 * d60) if (d10 * d60) > 0 else 0

    return {'D10': d10, 'D30': d30, 'D60': d60, 'Cu': cu, 'Cc': cc}

def classify_uscs(gravel_pct, sand_pct, fines_pct, cu, cc, ll, pi):
    """
    Fundamental Boolean Logic for USCS Classification.
    """
    if fines_pct < 5:
        if gravel_pct > sand_pct:
            return "GW" if (cu >= 4 and 1 <= cc <= 3) else "GP"
        else:
            return "SW" if (cu >= 6 and 1 <= cc <= 3) else "SP"
    elif fines_pct > 12:
        if ll < 50:
            return "CL" if pi > 7 and pi >= 0.73 * (ll - 20) else "ML"
        else:
            return "CH" if pi >= 0.73 * (ll - 20) else "MH"
    else:
        # Dual symbol logic requires deeper branching
        return "Dual Symbol Required (e.g., GW-GM)"